My girls will have awesome 21st birthday parties if they want them. Or, they will have startup capital, weddings, house down payments, or gap years. How, you ask? Some modest investments, time, and dependent capital gains harvesting.
Investing In Your Child’s Financial Future
When my oldest daughter was born, her uncle Dan gave her a gift of $100 with the following instructions:
New Baby-
Tell your Dad to open an investment account for you (if he hasn’t already) and put this cash into the account. When you turn 21, you can have a big party with all your friends!
Uncle Dan
Any time she received money from other family members, we bought more of Vanguard’s total stock index ETF, VTI. Turns out infants don’t really need much more than diapers and onesies. So, we asked family members for any gifts during her first few years to be cash too. I also split up my 529 contributions so that every paycheck I put a bit more into this account instead of the 529.
Over time, we just kept adding more shares. Once her account crossed $3,000, we converted it to Vanguard’s total stock index fund, VTSAX and set it to auto purchase a little bit each pay check.
It has been a very positive 5 years during her investment career. I looked at my records and plotted the historical growth of her UTMA account. Being a nerd, I also extrapolated 3 scenarios into the future:
At the low end, we’re just contributing $300/yr and the account grows at a rather paltry 3%.
The nominal scenario has us contributing about $850/yr with the account growing at 5%.
In the high scenario, we’re adding $1700/yr and it all grows at 7%.
Three potential growth scenarios for a child investor
It’s a proud papa moment when my almost 6 year old is able to peer into her young adult years and have between 25-95k in capital at her disposal. Thank you, Uncle Dan!
Now for the fun part: Dependent Capital Gains Harvesting
As the market moves up and to the right, I periodically sell VTSAX and buy something similar like Vanguard’s S&P500 index fund, VFIAX. This is a taxable event. We sold shares for a profit, and my daughter, our dependent, owes capital gains taxes on her earnings from the sale. Note: to keep things simple, I’m assuming no other types of income (no dividends, no interest, no earned income).
For minors in 2023, the IRS taxes capital gains on up to $2200 of unearned income per year at 0%. My oldest daughter is almost 6. This is her only source of income. While she is our dependent, as long as she doesn’t profit more than $2200/yr, she owes nothing on the gains for that year.
Once she is no longer our dependent, she will be eligible to pay “filing single” capital gains taxes. Let’s pretend that we’ll flip that switch when she turns 18. That may not reflect reality, but it’s an example. In 2023, for individuals filing singly, the IRS capital gains tax rate on up to $40,400 of taxable income is 0%. Let’s take the low balance scenario and see what her cost basis looks like at 21. Remember, we’re making some assumptions here:
Selling enough shares each year until she turns 18 to lock in $2200 of capital gains with 0$ of taxes owed
After she turns 18, selling enough shares each year until she turns 18 to lock in $40,400 of capital gains with 0$ of taxes owed. OK, this may not be as realistic, but it should illustrate the point
A Deeper Look At The Scenarios
Using capital gains harvesting for a dependent while she has $0 of other income, by the time she reaches 21, the entire balance of her after tax account will already have had the capital gains taxes paid…at 0%!
Low balance scenario where we contribution ~$300/yr & it grows at 3%. See how quickly the basis catches up to the balance (the purple line is right at the orange line by the time she is 7). That’s the power of harvesting capital gains for your dependents.
By making these taxable transactions periodically and harvesting her capital gains, she will incrementally increase the cost basis of her investments. As her new cost basis increases, she has a lower potential tax burden in the future. The next two scenarios are a little more aggressive, but also show the power of this approach. Here’s the nominal scenario (contribute about $850/yr; grow at 7%/yr) resulting in around $50,000 of investments with little to no tax obligation at age 21:
In this scenario, the growth is high enough that she needs one year of filing single to fully catch back up. The net result is that by 21, she has a big asset with little to no tax obligation.
Finally, the high growth scenario is truly exciting. Yes, we’re contributing $1700/yr, which could be a pretty high burden for some folks. And, the funds are growing at 9% year after year. That’s high, but not unreasonable, I hope.
There it is: nearly $100,000 of assets with ~$0 of tax obligations against them. How cool is that?
By age 21, she has nearly $100,000 of investments, again with nearly $0 in tax obligation. Have a crazy cool 21st birthday? OK! Pay off a big chunk of student loans? OK! Down payment for a house? OK! Seed capital for a business? OK! It’s enough that she can do almost anything…but she cannot do nothing.
Disclaimer: While we have a passion for providing entertaining, informational, and possibly useful articles about personal finance, we’re just random people on the internet with no formal credentials or expertise. Talk to a licensed professional advisor if you need advice.
A 50% decline is bigger than a 50% gain if it happens first. Let’s take a quick look at Sequence of Returns risk.
Your investment portfolio is represented by a pie, raspberry if you like.
Yes, that is a full pie.
Pretend that you have worked hard for 15 years, saving 54% of your income and are ready to embrace your financial independence. The day after you step into your new life, the market crashes 50%, wiping out half of your portfolio’s value. Think of your portfolio looking like half a pie now. Ouch.
One half of the pie. It was either “lost” due to declining portfolio value or after eating.
In our simple example, it is a volatile market. The very next day, the market soars 50%!
You’re back to where you started, right?
Nope.
You’re only at 75% of your original balance. A 50% gain after a 50% loss is only a 25% gain on the original amount.
Take away half the pie and then add half back. You don’t get the full pie.
If you needed to buy groceries or pay your mortgage (or make any withdrawal from your portfolio) while the market was down, you have even less left.
This simple example illustrates sequence of return risk where a decline in the portfolio happens shortly after someone starts to draw from it (e.g., in early retirement or FI years).
How to mitigate sequence of return risk:
Manage your asset allocation. Keep some bonds, cash, & stocks in your portfolio, especially if you’re planning to draw from it soon. In this way, you won’t have to sell stocks when they’re down in order to eat.
Continue to generate some income so required portfolio withdrawals can be reduced. If you keep working or pick up some extra work, that income can be used for living expenses instead of selling assets at a loss during an early down turn.
Should I refinance my current mortgage? Banks/mortgage companies want you to refinance your loans because they will make more money from you. Sure, they may advertise lower rates, lower payments and show pictures of smiling people having fun. Make no mistake: unless you do the math, odds are they will take more of your money.
With interest rates still low by historic standards, lots of folks have been refinancing to lock in lower payments. Add a booming housing market to the mix, and people are refinancing and withdrawing additional equity from their homes in droves. It seems like we get solicitations weekly from our own lender.
By the way, we’ve made this mistake too. Twice! Please learn from our missteps so you don’t have to make the same mistake.
Buying a House Is Like Buying a Car
Let’s start with an analogy. You are at the car dealership shopping for a different, used Camry. You have $2,000 in cash and want to stick to a 20% down payment. Therefore, your budget is $10,000. If you put down 20%, you need to borrow $8,000 to complete the purchase. For a 3 year auto loan at 3.69%, your monthly payment is $235.09.
Then the sales person says, “you know, I can get you into a new Camry for the same monthly payment.” Your ears perk up. New car smell for the same monthly payment? Maintenance free miles at the same price? Tell me more about how I could get more swagger for the same dollars.
You can’t, of course. Let’s see how this trick works.
For starters, take the first scenario and multiply the monthly payment of $235.09 times 12 for an annual total of $2821.08. Then multiply that times the 3 years you will have the loan. Your $10,000 car actually costs $10,463.25. The 463.25 is the interest you will pay over the life of the loan. That’s what financing will cost you. What could you do with that extra money if you just bought with cash?
Now let’s look at how our crafty dealer can get you more car for the same monthly payment. We’ll keep the interest rate the same, but we’ll push out the loan duration to 7 years. Let’s see how much we can borrow while keeping the payment no higher than $235.09. Looks like $17,375! Woo hoo! With your $2,000 in cash, you have a total of $19,375 to throw around. New car smell, here we come. The real costs of this upgrade are your indebtedness for an extra 4 years and a total of $2,367.03 in interest. Your $19,735 Camry actually costs you $21,742.03 over the life of the loan.
If you spend any time on “how much house can I afford?” websites, you’ll usually see that they focus on what your monthly payment will be. And, it works! According to an expert at Fannie Mae, 90+% of US home mortgages are 30 year loans.
Buying a House With a Loan Spends Your Future Earnings Today
Now, let’s scale it up. Houses usually cost more than cars. And, at least in the US, we accept 30 years as the typical amortization period. Once you sign on the lines, you have effectively pre-spent 30 years worth of income. (There’s a reason mortgage contains “mort” the french root word for death)
Why Banks Love New Mortgages (and especially mortgage refinancing)
I remember when we signed our first mortgage. We were pretty young. We knew this was not going to be our dream house, but it was our first house. Despite doing lots of homework, we never really had any one challenge our approach or suggest there might be another way (like house hacking). So, we went for a 30 year note to keep the payments low. The total interest we would pay over the life of the loan was almost double the principal. Let’s dig into how a mortgage is structured to better understand things from the bank’s view.
Let’s start with the concept of amortization. When you take out a loan, a lender gives you a sum of money. You agree to pay that sum back over time. The lender charges you interest as their price for the service of loaning you money. An amortization schedule is the sequence of payments over time where how you agree to repay the lender. By the way, amortization comes from old French/Latin. It means to “kill it off”. As in to destroy an asset that generates revenue. When you pay off your loan, you have killed one of the lender’s assets. Do you think they really want their assets killed off? (Hint: no!)
So you have a new letter in the main offering a mortgage refinance. Sounds interesting, right? Lenders love new mortgages because so much of a borrower’s payment goes towards interest. You need to look at an amortization schedule so you can see why. The amortization table shows the monthly payments for the life of the loan. It is your repayment plan. It also shows how much of each payment goes towards paying down principal and how much goes to interest. You can also see how much total principal and interest a borrower has paid.
Here’s a simple example. Let’s say a borrower took out a $200,000 mortgage. The duration is 30 years and the interest rate is fixed for the life of the loan at 4% per year. With these terms, each month, the borrower commits to pay $954.83. Because this is a 30 year loan, the full amortization table is 360 rows long. So, here’s a condensed summary showing every 36 months instead (with a couple extra highlight rows added).
Condensed amortization table showing when a hypothetical mortgage has greater than 50% repayment of principal and when cumulative principal exceeds cumulative interest
It Can Take Years Before You Pay More Principal Than Interest
A few observations from the table above:
Initially, almost 70% of the monthly payments are used to pay interest. Yes, you might be writing $1000 checks every month, but when you start, only $300 of that pays off the balance. $700 goes to your lender’s pocket.
It takes until the 154th payment (almost 13 years in) before 50% of the payment is applied to principal.
You have to wait until the 283rd payment (23 years!) before your cumulative principal payments outpace your cumulative interest payments.
Wait…what!?
No wonder bankers wear fancy suits! A new loan generates significantly more interest (potential profit) than an old loan. And, the longer the term (e.g., 30 years vs. 15 years), the more favorable the loan is for the lender.
Most People Do Not Pay Down The Full Balance Their Mortgages
Now that we understand why lenders have such a strong incentive to get you into a new loan, we can add another wrinkle. Mortgage companies/banks know you are unlikely to keep the loan to the end. According to the National Association of Realtors, the overall US “median duration of home ownership is 13 years.” And lots of folks complete a mortgage refinance even without moving. With rapid turnover on a 30 year mortgage, it can be difficult to build equity because so much of one’s payments go towards interest for so long.
That’s right. The 30 year fixed note that 96% of us sign up for is closed after 13 years. In our example above, that’s right about when each payment finally has 50% going towards principal. And a substantial number of folks close their mortgages before 13 years, meaning they accumulate even less cumulative principal payments than interest.
In addition, the lender gets the closing fees associated with originating the new loan (that’s the mortgage refinance). They get the most profitable period of time for the loan (where you gain the least equity and they gain the most interest). And then, as borrowers, we start their most profitable revenue stream all over again when we refinance or move. Who is winning here?
Now we know why banks sends so many refinance offers. It’s not really because they want to see us lower our monthly payments. What are the top selling points of these marketing campaigns? We can lower your rate. We can lower your monthly payments.
Now you understand why looking at just rate or monthly payments is a red herring. Unless your name is Jeff, Oprah, or Bill, you probably aren’t paying cash for your house. Or, maybe you want to take advantage of historically low mortgage rates. What are mere mortals to do?
Look at Your Potential Mortgage Refinance Like an Accountant
Run the numbers like an accountant.
Calculate time to be free of the debt.
Figure out how much less (or more) interest you will pay.
Bonus/Caveat: think about opportunity cost
First, run the numbers like an accountant: yes, you should consider your monthly payments. If you’re in a cash flow crunch (there is a pandemic on after all), freeing up several hundred dollars each month may be a huge relief. But understand that the short term relief comes with a long term cost. That’s why you need to look at more than just a lower rate/monthly payment.
Consider how much faster you can pay off the note. If you move from a 30 year to a 15 year note, depending on your original terms, you may get similar or smaller monthly payments and a shorter time horizon. For most people, eliminating the house payment eliminates the second biggest single line item in a family’s budget (hint: taxes are usually #1). And, anything that puts time back in your pocket aligns with our main life goal. “Time is the ultimate non-renewable resource”, after all.
Finally, look at how much less (or more) interest you will pay over the life of the new loan vs. your current note. If the change in interest rates is big enough, maybe you can justify refinancing into a new 30 year note. For us, we’re 10 years in, so it becomes really hard to make this criteria work because we’re mostly past the most expensive part of the mortgage now (smacks forehead).
Caveat/Bonus – Don’t Forget About Opportunity Cost
Don’t forget about opportunity cost. This is the counter example that could toss out all of the math and analysis we’ve talked about above — which is why it’s so important to mention.
The counter-example goes like this, “if you can do something else with the money that earns a higher rate of return for your risk tolerance, you could consider that instead.” This means, you might be able to refinance your mortgage into a 30 year loan at 3%, saving a few hundred dollars each month. If you can re-invest those dollars into something that returns more (e.g., a rental property earning 8%), you will have become the bank. You are now borrowing money at a low rate to invest it at a higher rate. And, that’s not a bad place to be.
Of course, there be dragons here too. The higher rate may come with more risk. And, this is why personal finance is … well… personal.
A Better Mortgage Refinance Calculator
One of the nice things about not trying to sell you mortgage products means we can tell it like it is. So we built a refinance calculator so you can compare two different mortgages to see if you can win on all 3 dimensions: monthly payments, time to freedom, and total interest paid to your lender.
Let’s walk through an example and then make the tool available. Consider our example from above: a $200,000 30 year mortgage at 4%. Let’s say the note started 1/1/2018. The borrower considers a couple refinancing scenarios.
Mortgage refinance to a new 30 year note at 3.25%
Mortgage refinance to a new 20 year note at 3.00%
Comparison of a 30 year note at 4% refinanced into a new 30 year note at 3.25%. Lower monthly payment and less interest over the life of the loan, but a longer time to pay it off.
In both cases, we’re holding the cost of refinancing fixed at 1.5% of the value of the new loan (although that is adjustable too). In the first scenario, the borrower has a lower monthly payment by about $228/mo. Because of the lower rate, they also save on interest over the life of the loan…not too bad. However, they’re pushing out the payoff date by almost 4 years. For some this is a great trade-off: more money in their pockets every month but slightly more time carrying debt.
Comparison of a 30 year note at 4% refinanced into a new 20 year note at 3.0%. Lower monthly payment and less interest over the life of the loan, but a longer time to pay it off.
On to scenario 2. What if the borrower chooses to go with a 20 year note at a slightly lower interest rate? They don’t get the same monthly savings…the new monthly payment is only $30/month less. However, they save over $60,000 over the life of the new loan. And, they are debt free 6 years earlier. That’s what I would look for in a refinance: accelerating my Speed to Freedom!
Coming soon! A mortgage refinance calculator upgrade that lets you have a shorter time horizon.
It’s now a tradition for bloggers to do year end write-ups and forward looks. This post certainly aims to pull together threads of a 2020 review and a 2021 look ahead. I’m also introducing a demonstration of exponential growth and a trade-off between two different modelling approaches. Let’s begin. while my general sentiment is to say, “Good riddance” to 2020, we’re super privileged to have escaped mostly intact (knocks on wood)…
Let’s start with what matters most:
Health
We’re healthy, all of us. We took as many precautions as we could to minimize our Covid19 risk throughout last year. We’re patiently waiting for our turn to get vaccinations and look forward to some semblance of normalcy. Our hearts go out to the millions of families who have lost loved ones and to the millions more whose lives have been upended.
We survived the in-hospital birth of our second child. We now have two healthy girls! After a significant scare with my wife’s health post-delivery, I have a healthy partner again. I am so grateful to have healthy girls in the house.
Next, as this is a website about the journey to financial independence, let’s talk money.
Wealth
I actually wasn’t planning to write a 2020 review/2021 forward look. But, then I stumbled onto a thread at boggleheads about the shape of folk’s net worth curves. I think this is a fascinating topic and worthy of exploration. As we’re still starting out the 2021 calendar year, I was inspired to reflect on several lessons from 2020 and look forward to 2021 and beyond.
Exponential Growth Is Real
The path for financial independence feels like a marathon. But, unlike a marathon, the first miles on your journey to financial independence are the hardest. We scrimped and saved to pack pennies into our accounts only to see minor or maybe modest gains year over year. It felt like financial independence was totally out of reach. But, through the steady inspiration and encouragement of the online personal finance community, we kept at it. We’re not there yet, but that exponential growth curve makes me do a double take every time I see it.
Here’s a plot of our net worth since I started tracking it in 2009.
Exponential fit of our net worth growing over time. How cool is that!?
While it doesn’t feel life altering yet (in part because we cannot touch most of our net worth), it sure looks like we’re on an exponential growth curve, even with our conservative asset allocation. Why do I think this: a little statistical concept called standard error.
Standard Error
I’m not going to delve deeply into stats here, but this concept is useful here and will be again in many of the other topics discussed. Standard Error is a measure of spread. It tells is how much distance is between a group of data and some statistic. In this case, we’re looking at how far the points are from the fitted line. When comparing different models, smaller standard error (less distance) means the fitted line is likely a better fit for this data.
Let’s try it. We see the fit and standard error for the exponential growth model. Here’s the same data with a linear fit. Just eyeballing it, you can see this line doesn’t match the data as well. Standard error calculates the distance from the fit line to each point. Models (lines) with better fit have smaller standard error.
Linear regression model fitted to our net worth growth over time. Not such a good model, but in this case, I’m OK with that.
Take a look at the exponential model again, especially at the most recent months. The most recent points are consistently above the fitted line. You could attribute this to our investing genius. Or, maybe irrational exuberance round 2. This model is not perfect either. We need to be very careful not to extrapolate too far into the future lest the difference between the model and reality becomes too big. I don’t think we’ll be 401(k) billionaires in 20 years!
Between the two models, it’s obvious that exponential growth is a better fit, both visually and using math. Now that we can measure our net worth growth and fit a decent model to it, let’s dig into why the shape of the curve looks the way it does. We’ll also discuss what we could be doing differently to change the shape.
Analysis: Why Our Net Worth Is At An All Time High Despite The Pandemic
Despite the worst health crisis in a century, our net worth is at a record high. Why?
We kept our jobs
We benefit from the booming equity market
We benefit from the booming real estate market
Our rental business has lower but still positive cash flow
We Kept Our Jobs
Let’s take each in turn, starting with our jobs. Like it or not, our jobs provide 90+% of the income into our lives. Therefore, as much as I grump about being a W-2 employee, these revenue streams are important! We both work hard to contribute as much value as possible to our employers in the hope that they will continue to provide gross income in exchange.
Call it fate or luck, both of us have continued to be gainfully employed throughout the pandemic (knock on wood!). This means our ability to save/invest/grow net worth continued throughout the pandemic. One of my favorite pod-casters has a whole series on why the number one task of any employee is: “Don’t lose your job.” Obviously, that can be easier said than done depending on the industry and ones’ specific circumstances. Regardless, the number one priority for each of us is to maintain our respective revenue streams.
We Benefit From The Booming Equity Market
While we’re not 401(k) millionaires (nor “Teslanaires”), we have consistently invested in a broad mix of index funds for the past ~20 years. (OK, OK, we do have some “dumpster fire money” in individual stocks). That said, we’ve largely maintained an asset ratio of 60% stocks and 40% bonds over this period. We re-balance when things get too far from that mix. I know: it’s boring. No options trading. No short selling. I couldn’t even tell you what a put or a take is. And, I don’t really care. What I do care about is the overall growth of the equities market, namely the S and P 500 and the total market indices. Their values have exploded relative to the values of our other asset classes (e.g., bonds, cash, and real estate).
If I am honest, over the past several years, stocks have been the main engine of our net worth’s exponential growth. We keep these other asset classes around for when the market inevitably turns. But, just like JL Collins says, “Toughen Up Cupcake.” Embrace the volatility that comes with exponential growth via the stock market.
We Benefit From The Booming Real Estate Market
Speaking of other asset types, real estate remains my favorite. I love the tangibility of it. I love the chance to provide meaningful value directly to other people. I love the way the government treats it when tax time rolls around. Thus far, we only have one rental unit, a nice 2 bed, 2 bath condo. We took this plunge back in 2015. While we’ve had one challenging tenant, for the most part, it’s been an awesome investment. We negotiated with our current tenant at the start of the pandemic: lower rent in exchange for an 18 month lease. It was a relief not worrying about filling an empty unit during the lockdown. Most importantly: we’ve been able to maintain positive cash flow throughout these crazy times.
And, guess what, due to the booming real estate market, the theoretical value of the property rose too. Of course, we’re not interested in selling any time soon. But, we do track the market value of the property as part of our net worth (discounted to an investor friendly price). Lately, our real estate has grown, maybe not with the same exponential growth that equities have, but I believe real estate will be a lot less volatile whenever the next downturn comes.
Our other real estate, our primary residence, also shows a decent lift in the market value. Again, we’re not planning to sell any time soon, but these increases do contribute to net worth growth. They also buffer our net worth during down turns. While real estate may not be negatively correlated with stocks, it tends to be less volatile. Unfortunately, our house (like everyone’s) is not really an asset. It consumes cash rather than contributes it.
Our Rental Business Has Lower But Still Positive Cash Flow
You cannot eat net worth.
This is an interesting realization. So many of us are taught to invest in stocks and bonds so that we can take advantage of their long term appreciation. The plan is to sell some of these appreciated assets during our retirement years. The hope is that we draw down our pile slowly enough to die before we run out of money. As long as you stick to certain assumptions, this works pretty well.
Let’s talk about tax deferred retirement accounts for a minute. If you want to draw from your retirement pile before retirement age, the government charges a fee of 10% Further, because you put tax advantaged dollars in, you will pay income taxes on the dollars you take out. No opportunity to pay the potentially lower taxes on dividends or capital gains.
The cash that a rental property generates (assuming it is not held in a tax advantaged account) is available for use immediately. And you don’t have to sell a bathroom from your rental property to get the income. (This is unlike stocks where, unless you are only spending the dividends, you have to sell part of your base.) That’s what rent is for. I can feed my family today using the positive cash flow from our rental. Or, I can reinvest it for the future. This flexibility is awesome.
When the pandemic hit, our tenant reached out to us looking to renew his lease with us. In exchange for an 18 month agreement, he asked for a 20% discount. He’s a great tenant, and there was a pandemic just starting! We wanted to keep him We did a little math and offered a 15% discount. We agreed and signed the new lease. I’ve never been happier to give a discount! So, while our business income is down, we avoided (for at least a while longer) a dreaded vacancy.
Resiliency
To me, all these things add up to the beginning of a resilient lifestyle. If one part of the system fails, the rest of the system can absorb the shock and we can continue onward. It helps that we have a pretty big gap between our total income and our total expenses, again part of a resilient system is avoiding overloads. For example, if I lose my job, between my wife’s job and our other income sources, we could continue to maintain a substantial portion of our current lifestyle. If we have a vacancy in our rental property, we can afford to cover the expenses using cash reserves and surplus income until we can get a new tenant. We have tried to set up our affairs such that some part (or parts) are always able to perform.
To see a master of multiple income streams and truly resilient financial setup, check out John C over at actionecon.
There will be ups and downs; there will be bumps in the road. The hope is that through good times and bad, we continue to stay the course: keep earning, saving, investing, and growing. When the pandemic hit and now, as things recover, our assets continue to grow… hopefully for decades to come.
Actions to Take in 2021
No one has a functional crystal ball, so I’m always leery of forecasting economic or market movements. Regardless of your circumstances, I think there are some fundamental ways to approach finances in 2021.
Grow your gap either by increasing your income or decreasing your expenses. This is a good action to take in almost any set of economic circumstances, market conditions or time of your life. Today is no different. The job market may be terrible or amazing; reducing expenses gives you more financial runway in case of a change in your employment. The market may be high or low. Having a bigger gap gives you the ability to invest that cash directly or save it for another opportunity.
Adjust your asset allocation. Whether 2020 was financially kind or terrible for you, it’s a good time to review your specific situation and adjust your mix for the coming year(s).
By some measures, the US stock markets are significantly over-valued. If your asset allocation percentage is out of balance, this might be a good time to rebalance. You can lock in your gains from the past 10 months of ear-popping highs. Be sure to balance prudence with the fear of missing out. No one knows how high (or how low) an asset class will go tomorrow.
Age adjustments. We turn 40 this year. We have 2 kids. Our risk profile looks way different now than it did 15 years ago. Back them, we could say go all-in on the stock market. Now, our asset base has grown, and our appetite for full risk has perhaps decreased a bit…or not. I’ll save a discussion of how we approach risk/allocation for another time. Regardless of what our asset allocation was for the past 10 years, we may need to have a different ratio for the next 10 years simply because our runway to needing to use our assets is a lot shorter. And, the same may be true for you. Think carefully about how much risk you are really willing to accept. My heart goes out to the family of this young investor who took his own life after (mistakenly) thinking he lost almost $750,000. I know our allocation is pretty conservative, but I sleep well at night. I hope you do too.
Pay down debt. For us, this would most likely be early payments on the note at our rental/primary residences. We’re not rolling the dice with Bitcoin. Instead, every extra dollar we pay towards our mortgages, comes with a guaranteed interest cost that we avoid paying. It’s like our own bond fund.
Keep plugging away; exponential growth is alive and well. With that, we wish you and your loved ones a prosperous 2021 and beyond.
2minute readWhy does it take so long to save $1000? Every guru will tell you to start by saving at least $1000. But why does it take so long?
2minute read
Start by saving $1000
It’s good advice.
Let’s face it: when you are just starting out, it takes a long time to save money. It can feel like it is taking forever to save your first $1000.
But, that first $1000 forms the basis of your emergency fund. It is the thing that will cover life’s unexpected obstacles and keep you from back-sliding into ruinous debt. If you are just starting out, working diligently until your savings account (not the spending checking account!) has at least $1000 in it.
Blown tire? You’re OK
Dental emergency? You’re OK
Flight home for a funeral (outside of COVID-19)? You’re OK
Family member in need? You can help
Home repair? You’re OK
Enough with the lecture; you know you need to save the money for your emergency fund. Let’s explore why it takes so long as this is where the real opportunity exists.
Saving $1000 is not the only place your money goes
Your emergency fund (or whatever other savings goal you are working towards) has a lot of competition:
Taxes
Retirement savings
Required expenses (housing, food, transportation, child care, etc.)
Or, when considering a purchase, a lot of folks will tell you to take the purchase price and divide by your hourly wage. That will tell you how many hours you must work to afford the purchase.
Let’s say your family has single income earner and they earn the median US American household income of about $63,000/yr. At 2000 hours per year, their hourly rate is $31.50. Conventionally, you need to spend 32 hours (1000/31.5) to fully fund the first $1000 of your emergency fund. That’s less than a week of work! Unfortunately, it’s not that easy. If it were, I would say see you next week when you have saved $1000.
You don’t keep every dollar you earn
Let’s think about it a bit differently to understand why. You don’t keep every dollar you earn; you have to pay taxes, housing, transportation, food, entertainment, and everything else you typically spend.
Lets say you earn $63,000 as before, but your saving rate is in line with the US American savings rate of 6%. (Networthify has this awesome calculator showing the relationship between savings rate and career length). This means that 94% of your earnings already pay for taxes, housing, transportation, food, entertainment, etc. Without making any changes, the money to fund your savings needs to come from your unallocated budget, the 6%.
Trouble is: 6% of $63,000 is $3,780 of savings per year. Your hourly savings rate is $1.89/hr That’s what you pay yourself. At 6% of gross earnings, that’s downright miserly. At this rate, you need to work over 1/4 of the year just to save $1000. If you start on Jan 01 with $0, you will save $1000 by April 6.
3minute readIf you could afford to retire (or consider yourself Financially Independent) earlier, wouldn’t you want to know? Check out our app and see if you can reduce some of the uncertainty around your future expenses!
3minute read
TBD min read
If you could afford to retire (or consider yourself Financially Independent) earlier, wouldn’t you want to know?
I’m pretty risk averse. So, I look at the simple rules some people use to evaluate their ability to walk away from work with a bit of skepticism.
The most commonly touted ways to estimate forward looking financial needs are the 4% rule, from the Trinity Study and the 80% of income guideline, from the BLS Consumer Expenditure Survey. Just so you know I’m not making this up, please take a look at Fidelity’s source for their 80% # here.
Example: I’m a 38 yr old software engineer and single. I’ve saved $750,000 through extreme frugality and a high savings rate. Using the 4% rule, I can safely withdraw $30,000/yr, covering my lifestyle. I am FI and planning to walk away from my full time job soon. Should I?
Maybe. First, pat yourself on the back for being FI now. My hesitation stems from the uncertainty around annual expenses of $30,000. What if you:
Any one of these events (and a whole lot more) could result in significant changes to your financial picture. And that’s the point: understanding how your expenses change over our lives can better inform your planning efforts (as a new Dad for the second time, I can say for certain: little girls are expensive).
We set out to build a view of people’s expenses as they move through life. We found the Bureau of Labor Statistics’ Consumer Expenditure Survey and spent some time working to visualize the data to give folks a better idea of the range of expenses that participants in the survey group faced at different times throughout their lives. It is important to note that these are not the same people surveyed at multiple ages; rather, the BLS surveyed lots of people across different ages.
Start by entering an income value and then selecting demographics values. This will filter the dataset to provide the subset of matching folks and automatically update the displays.
Variation matters.
In the output pane, you will first see an income histogram. This shows the shape of the distribution of incomes for the survey participants with the same demographic data. Sometimes people will use an average to represent the center of a distribution. We don’t think this makes sense, especially when we’re trying to understand uncertainty and when the distribution is skewed. We’re displaying where the entered income falls within the distribution of similar folks from the survey. That gives us a percentile, or position in the distribution. (i.e., the 65th percentile is the income where 65% of the other incomes are below it).
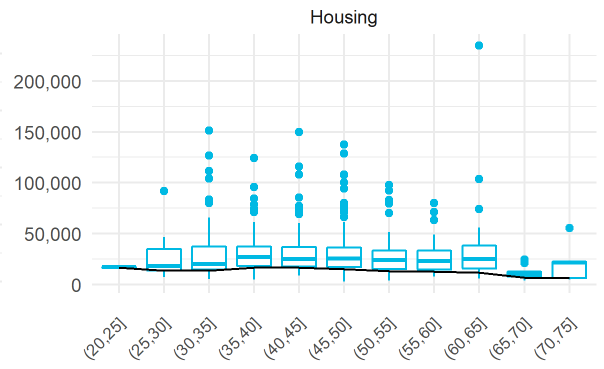
Next, we take the distributions of expenses for all the folks with the same demographics and split them up by age group. We visualize all these distributions using boxplots (if we used histograms, it would be tough to see all the data in a small, useful space). So, think of a boxplot as a dense picture of a distribution.
By Jhguch at en.wikipedia, CC BY-SA 2.5, https://commons.wikimedia.org/w/index.php?curid=14524285
In this case, each boxplot represents the expense category for one age group. Notice how the shapes of the boxplots change within an expense category for different age groups. We’ve also overlaid a black line that shows the expense percentile over age group based on the income percentile entered as input. Because, it can be tough to see the actual numbers this way, our tool also provides a table of these values.
Check out our app and see if you can reduce some of the uncertainty around your future expenses!
We are buying a Big A$$ House and it scares the living daylights out of me. So I’m going to blog about it.
First, let’s define big.
Six bedrooms. Four for immediate family, one for guests, and one to offset the cost (more on this later) of all the rest. Four+ bathrooms. Probably north of 3000 square feet of climate controlled goodness for us humans, one dog, and our Stuff.
Next, let’s talk money. In our neck of the woods, if we buy this kind of turnkey place, it’s probably $800,000. No, that is not a typo… let me write it out to be certain you fully grasp the magnitude: Eight Hundred Thousand Dollars. My heart is racing again just thinking about it.
If we bought a fixer, we might be able to get an old and busted place for $450,000. Then, we need to put in up to $150,000 to fix it for a total of $600,000. These are just estimates of course, but I’m already seeing opportunity!
As I write this in Dec 2019, interest rates are around 4%. Let’s say we’re able to put in $160,000. (We’ve been eating a lot of peanut butter and jelly to save for this). At 4%, our monthly payments are ~$3100 for the put-your-toothbrush-in-the-bathroom-and-it’s-ready purchase and ~$2300 for the fixer, assuming full financing of the renovation. I know there are intangibles: whoever heard of a full gut-job renovation going smoothly? But I do believe the market charges a premium for no-hassle.
Next up: maintenance, taxes, bills. Let’s assume these are equivalent between the two options. A good estimate for maintenance is 1% of the house value every year. That’s $8000 per year.
Taxes in the county we’re considering are $1.014 per $100 of assessed value (1.014%). Again, let’s keep things simple and assume the assessed value is $800,000 for the ready to go. Taxes become $8,112/yr. For the reno option, we’ll assign the assessed value at the purchase price + repair value. I think that will be conservative. Reno taxes are then close to $6100/yr.
Bills (Gas, Electric, water) can be pretty significant when you’re heating/cooling such a big space. An efficient build averages $210/mo for a total of ~$2500/yr. Let’s apply that to both options.
Add that all up and our annual recurring costs for each of the two options look like this:
Ouch. we’re basically locked in to this cost of living for the next 30 years.
Now, let’s make this a bit more exciting. We’ve planned to take on a renter in either case. As part of the deal, each property must have a 1 bedroom suite in the basement. The suite must be isolated from the main house (with a locking door), have a kitchenette, separate access, and a full bathroom (at least a shower). Rents for a 1 bedroom/1 bathroom apartment in this area range from $800-$1200 per month in this area. Let’s pick the midpoint of $1000/mo to keep the math easy.
All of a sudden we get an extra $12,000 of rental income to apply to the total recurring costs. And, we can write off a proportion of the recurring costs. For a 3000 sqft house, we would estimate 500 sqft being allocated to the rental. That means we can write off 17% of every expense associated with the property. Here’s the line item reductions:
Turnkey ($800,000 purchase) total offsets: $15,105
Remember these are deductions not credits. To accurately estimate our total expenses, we need to apply our tax bracket first. Let’s say we’re in the 24% tax bracket. Here’s the final costs of these two options once the reductions are included.
This still is no yurt, but it’s a whole lot better than just paying out of pocket.
If you are in to frugal living, the entire concept of a house like this is probably just silly. But, if you live in a high cost area, are trying to get your kids into good schools, or simply have the ability to hack your residence, it can be a very worthwhile endeavor. Some other house hacks to consider:
3minute readWe’re in the market for a new house/rental property. We’re considering house-hacking, a mixed use rental property where we live in one part, and rent out another.
3minute read
4 min read
We’re in the market for a new house. Because I’m cheap we’re on the path to financial independence, I want to incorporate a rental property. Fusing the two is a form of house hacking, a method of turning your single family home into a small multi-family rental property. Today, I’m going to walk through how we are analyzing the cash flow for a house hack where we combine our primary residence with a rental unit.
A friend of ours passed along a community for us to look into. I figured it’s worth showing our evaluation approach (OK, it’s my evaluation approach. My wife is much more interested in the big picture rather than how the math is done).
The community is in Fulton, MD. (Montgomery county for those of you that read my last post on growing counties in MD). Fulton is a planned community under construction. It has a Town Center with a community area complete with exercise facilities, a pool, and common spaces. There’s a mix of neighborhoods, ranging from apartments, condos, and townhouses to single family “estates”. The community is in the southern part of Howard County MD, so it definitely checks our box for good schools.
Let’s talk more about the math of evaluating a mixed use rental property where we live in one part, and rent out another. While we’re not explicitly looking for a duplex, that’s essentially how I’m approaching this topic. Here’s two of my favorite bloggers weighing in on general rental property evaluation: Afford Anything, and Financial Samurai. Finally, here’s an article specifically about duplex investing on Bigger Pockets, one of the biggest real estate blogs out there.
Analyzing Cash Flow When Hacking Your House
Let’s start with cash flow. For a typical owner “un-occupied” (rental) property, cash flow must be positive to even think about moving forward (rents must be higher than expected costs). In your personal residence, total costs should be less than some % of your gross income. We’re looking to blend the two, For better or worse. See how this seems different: we’re looking to buy a place with a portion of the costs offset by a renter. If it was a classic duplex, we’d likely want to “live for free” such that the renter covers not only their portion of the costs but 100% of ours as well. Somewhere between “live for free” and rents subsidizing our lifestyle is the trade space we’re looking into.
With that said, the math still ends up being pretty straightforward. Here’s a link to the spreadsheet I’ll be using to evaluate potential properties that fit into this kinda-sorta-duplex. (Note: I am tweaking a spreadsheet that I use to evaluate potential rental properties, so don’t worry too much about the Cap Rate, Cash on Cash %, or NPV metrics.)
We can estimate what an individual property will cost us to own and operate/maintain as our primary residence. We can estimate market price point for a rental property that looks like ours. E.g., a 1 BR1BA basement apartment. We can subtract the two to find out what our net cost of living will be.
Financials of house hacking where rental income offsets primary residence expenses.
If you add up the monthly costs above, it would cost over $5,000 a month to live this way! But, by taking on a renter, we can drop our estimated net costs to about $3,500 a month (and that is before any tax benefits).
Next, appreciation. Zero (this one is easy). I never assume we’ll benefit from any appreciation on a rental property. There’s some good reasons for this: real estate tends to appreciate only as fast as inflation. This keeps the math simple when evaluating prospective properties, and keeps my analysis conservative.
Finally, taxes. I figure out what the estimated property taxes will be so I can factor them into cash flow. The source for the tax information is either based on the listing (if available) or the historical tax records…You know those are all public records, right? Here’s the MD website. And, here’s a link to an online public records search site so you could look start your search anywhere in the US. After that, any deductions, expenses, etc are all gravy. I would never advocate buying a rental property just because of the tax benefit. The underlying investment needs to be sound first.
So, how does our primary residence/rental unit stand up?
Now the good news. A 1 br/1ba in this neighborhood is also a pricey affair. I saw $1,900/mo as the nominal rent for such an apartment. So long as we don’t mind neighbors downstairs indefinitely, we could end with a net monthly cost of $3,468.19. That’s still a big number, but it helps to illustrate why I’m so keen on having a rental property baked into whatever becomes our next home. Note that I took a wild guess to arrive at ~20k to convert part of the basement into a rental unit. Here’s hoping that’s in the realm of reasonable! Because these numbers are still pretty big for us, I’m leery of making this kind of commitment without doing some serious homework.
What do you think? Would you ever accept a long-term rental situation in order to afford a big honkin’ house? Is there another way to make this kind of move and keep it affordable?
…Over a decade and a half. I know: bad trick, using the headline that way.
But seriously, almost everyone in the personal finance space now talks about how using low cost investing options is a good idea. Put your money in index funds rather than actively managed mutual funds or with an adviser.
Why?
One word: fees.
Unfortunately, the investing world does not operate on the, “You get what you pay for” principle.
And, over the long haul, those little fees add up to be a drag on your returns. How big of a difference? Let me tell you a story…
My First Foray Into Investing
When I was 18, my Dad gave me a gift that I will never forget. He started me (now us) on the path to financial independence.
When I was 18, I had my first W-2 job working as a sales associate in the electrical section of the regional hardware store. (I worked for years before that, but I was always a small amount and paid in cash, so it was never eligible for taxation let alone retirement savings.) At the then-minimum wage rate of $5.15/hr, I didn’t make much. But, the little I made was reported to the government as earned income. “Fortunately,” my earned income was so small, I was ineligible to pay taxes.
I was using the money I earned to pay for some of my college expenses. So, my Dad said he would match up to my earned income and put the money into something called a Roth IRA. Of course, this became table stakes to hold a discussion on the general topic of saving for retirement. We talked about the differences between a Roth and a traditional IRA. We talked about contribution limits and the difference in withdrawal rules. Once, we made it through the lecture, we got into the fun stuff: what to do with the money. Pretty quickly, we ruled out a down payment on a car or storing it in my sock drawer. Instead, he suggested investing in a mutual fund, The Growth Fund of America (ticker: AGTHX). AGTHX is, you guessed it, an actively managed fund. Its annual expense ratio (one of several potential charges people pay to invest their money) is 0.62%.
Active Fund Fees Are A Real Drag
So, why is that a problem?
If a typical index fund charges ~0.1% in fees, the observation is that actively managed mutual funds at ~.6% or a human adviser at ~1-2% don’t make you enough extra money in the long run to justify their cost.
Compare AGTHX to Vanguard’s S&P500 index fund (Admiral shares because we’re over $10,000). The Admiral shares have an expense ratio of 0.04%. While the Investor shares (minimum of $3000) have an expense ratio of 0.14%. Last, I checked, 0.6% is more.
But, wait! You say, “don’t the hotshot fund managers get a better return for their customers?” How else can they justify charging more?
Maybe…
Let’s look at the numbers.
I used Morningstar’s portfolio analyzer to get a bit more information. Note that it only looks at changes in share prices (no capital gains/dividend reinvestment included). I simulated buying $100,000 of each fund on Jan 5 of 2001. How have the two funds done over the past ~20 years?
Ouch. Let’s make this even more apparent. If you look at a Google Finance image of the two mutual funds’ values over time, it looks kind of like this:
So, what gives? At almost no point in the past 20 years was AGTHX returning a higher rate than VTSAX. I think this illustrates something called “reversion to the mean”. That’s fancy talk for an idea that most investments eventually deliver average performance. They may out/under perform for years or a decade and a half, but eventually, they produce average results. This is one of the core reasons for selecting low-cost index funds as your primary investment vehicles. Over the long haul, if most funds perform similarly, then the lowest cost fund wins. You can read a lot more about this from John Bogle, inventor of the index fund, founder of Vanguard, and personal hero. While AGTHX may have outperformed VTSAX before the internet was widespread, in more modern history, VTSAX has outperformed. Yet, AGTHX consistently charges fees that are almost 10x higher. What?
By the way, those fees are pretty insidious. If you look at your statements, you will not see actual dollar values coming out of your account. Instead, the fund management team takes them off the top before they show up in any individual statements (I spent a few hours looking through some pretty arcane sections of both American Funds and Vanguards websites before I convinced myself of this).
Deciding To Make A Change To Indexing…Or Maybe Not
So, now the conundrum. I admit, it’s an emotional one. Math says, roll everything from AGTHX into a lower cost fund (e.g., VTSAX). Our goal is not to tap these funds for at least a few decades. So, shedding the fees should be the right decision. But emotion says maybe those über-smart folks at American will outperform the index once again. And, what about diversification? If hackers get into Vanguard, they may not simultaneously get into American. And besides, my Dad is the one who got this ball rolling, even if I’ve done the vast majority of the contributions. I feel some (totally irrational) guilt at moving away from this fund.
So, what to do? I’d love some other perspectives…drop me a line in the comments.
< 1minuteThe simple, frugal, socially connected lifestyle of Okinawans can teach us a lot about how to achieve financial indpendence.
< 1minuteIt’s only my third time in Okinawa, but every time I visit, I learn a bit more about Okinawan culture. Each time, I marvel at their resourcefulness and the many ways they live fully and healthily yet frugally.
Okinawans laugh … together. Over a cup of tea and a small snack, there are always funny stories of kids, grandkids, and neighbors. At least that’s what they tell me. Not understanding shimakutuba, I have to trust that’s what is actually being said. It’s a fascinating exercise: observing a conversation when you understand almost none of the spoken words.
Okinawans are social. We’ve been staying with family while we’re here, and at least once a day, a random neighbor, friend, or relative stops by to say hi. Inevitably, they have a small omiyage or gifts to share. Okinawan omiyage are often fresh from their own gardens, (and therefore free!).
Speaking of the garden, so many food items grow well in Okinawa. On a small plot of land, our family has 4 kinds of citrus trees (lemon, shiquasa, tankan, and kabochi), bananas trees, and persimmon trees. There are green onions, cabbage, carrots, and a staple: Okinawan purple sweet potatoes. Finally, a number of chickens inhabit the property providing fresh eggs daily. You can literally have half or more of your basic food provided fresh from the garden! Growing up with little money, our family did exactly that.
There is so much goodness that comes from having skills to survive without just pulling out cash (or a credit card). We can all learn to stand on our own two feet a little more.